Super Bowl Sunday is unlike any other day in sports betting.
More money enters the market, more opinions are shared, and more narratives dominate the conversation. Every matchup angle is debated, every player storyline is amplified, and player props become the most popular way people engage with the game.
That combination makes Super Bowl Sunday exciting, but it also makes it easy to lose discipline.
This is where predictive models matter most.
Narratives ask questions like who will “step up” or who the moment favors.
Predictive models ask different questions.
What does historical usage suggest?
How often does this outcome occur?
Does the line match the expected distribution?
Those questions don’t change because the game is bigger.
Rithmm applies the same model-driven process on Super Bowl Sunday that it applies across the entire NFL season.
To show how that process works in practice, here is one model-backed example from today’s game.
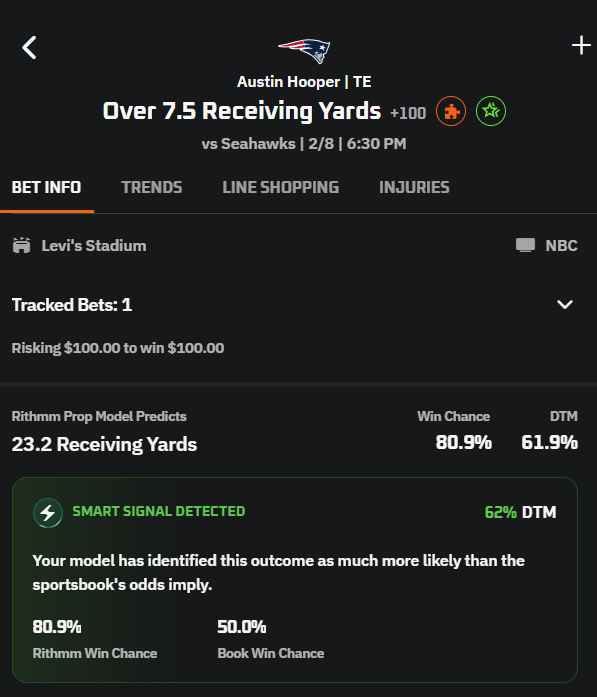
Austin Hooper Over 7.5 Receiving Yards
This is not a flashy headline prop. That’s the point.
Rithmm’s NFL prop model projects Austin Hooper at 23.2 receiving yards, well above the posted 7.5-yard line. The model assigns an 80.9% win probability, and a Smart Signal is detected, indicating the outcome is meaningfully more likely than the sportsbook’s implied odds.
From a trend perspective, Hooper has gone over this number in 70% of recent games, with an average of 17.2 receiving yards across that span.
This is what a model-backed edge looks like. It’s not about stars or narratives. It’s about role, opportunity, and probability.
On Super Bowl Sunday, most attention flows to touchdowns and headline players. Low-threshold yardage props are often overlooked, even though they are driven more by usage than by game script.
Predictive models tend to surface these types of plays because they focus on expected outcomes, not storylines.
That’s especially valuable on a day when emotion dominates decision-making.
This example is consistent with what Rithmm’s NFL prop models showed throughout the regular season.
Recommended NFL player props during the regular season finished:
Opening lines: 1340–1082, +119.78 units
Closing lines: 1387–1170, +84.09 units
Certain prop categories stood out in particular:
Receptions: 373–306, +29.87 units
Rushing attempts: 187–121, +52.12 units
Rushing yards: 182–123, +42.87 units
Receiving yards: 308–248, +23.21 units
Volume-driven props consistently outperformed narrative-driven ones. That pattern does not disappear on the Super Bowl.
Same Process, Biggest Stage
The Super Bowl does not require a new strategy. It requires sticking to a good one.
The same predictive modeling process that works across the season applies on the biggest stage of the year. The crowd gets louder. The math stays the same.
Super Bowl Sunday simply magnifies the difference between disciplined decision-making and emotional betting.
Super Bowl Sunday is full of opinions. Predictive models provide clarity.
The example above is shared to show how a model-driven approach looks in real time, not to promise outcomes. It’s one illustration of a broader process designed to keep decisions grounded in probability rather than hype.
That’s how serious NFL prop bettors approach the Super Bowl, and it’s why the same framework continues to matter most on the biggest day of the year.