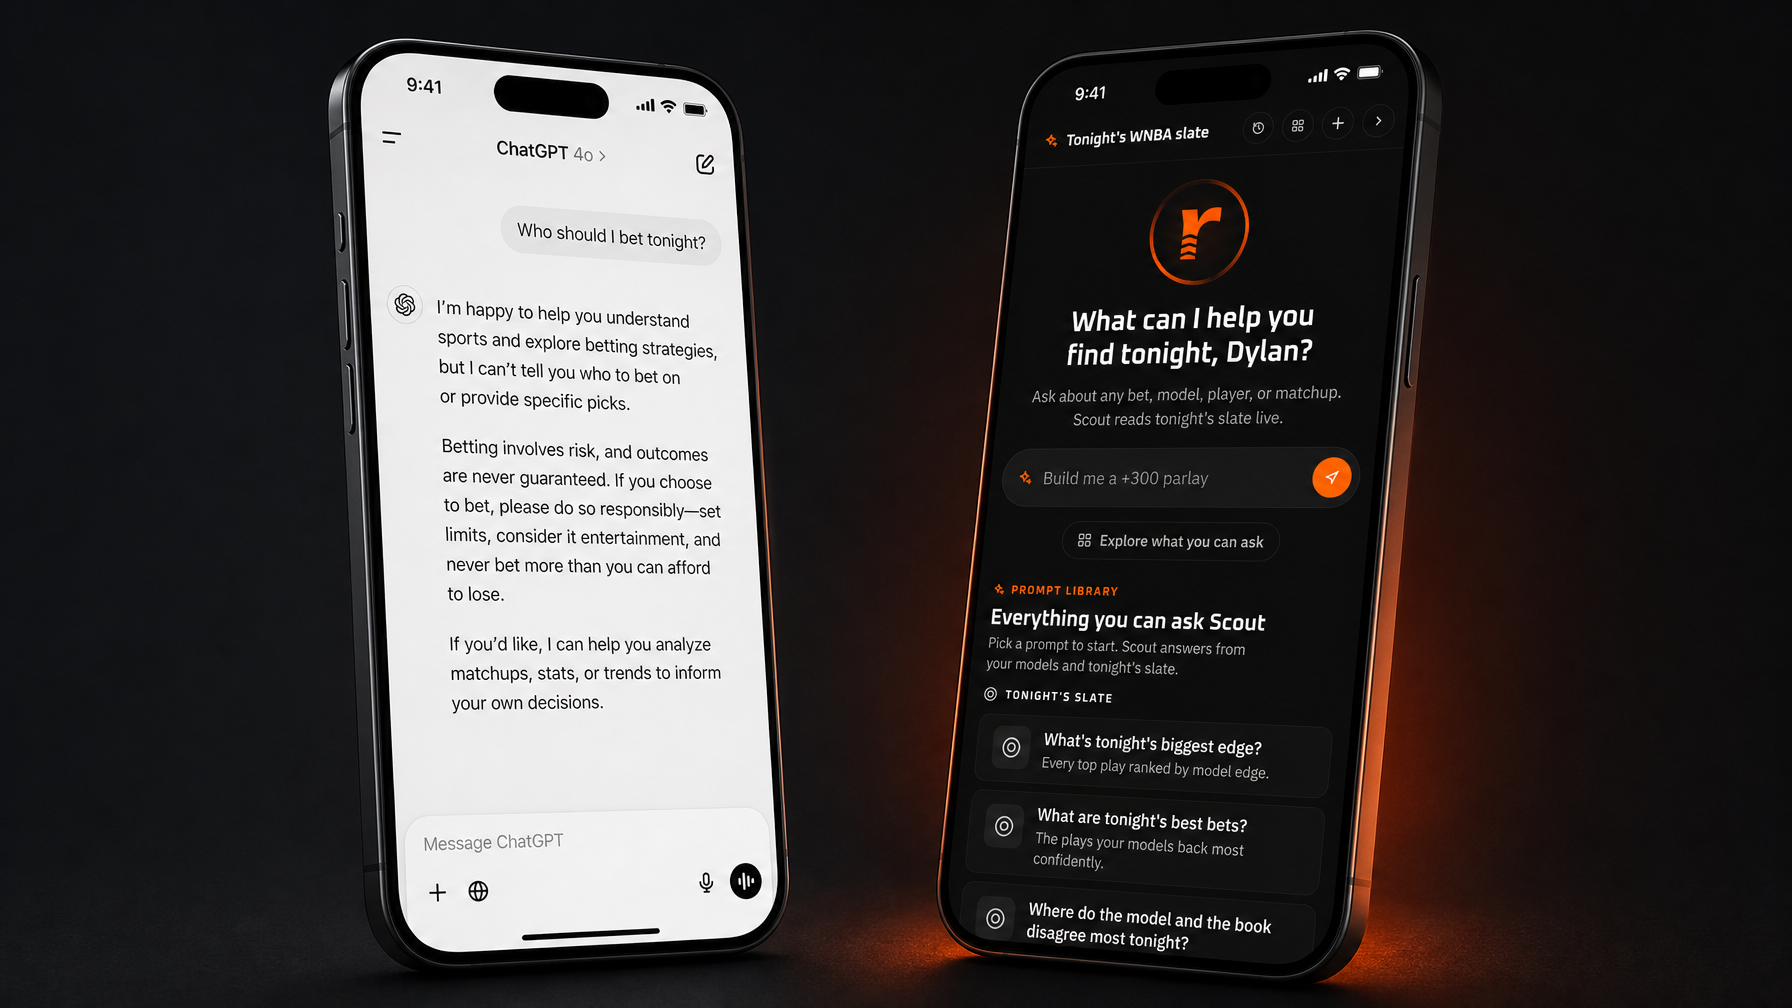
Most people betting on MLB games tonight are working off the same three data points: who's pitching, whether the lineup is hot, and maybe a quick check on home/away splits. That's not a model. That's a gut feeling with extra steps.
A real MLB predictive model looks completely different. Here's a look inside what Rithmm actually processes before a single pick surfaces — and this is just the tip.
Box scores are public. Anyone with an internet connection has access to ERA, batting average, and recent game logs. If your edge comes from public data, it disappears the moment the sportsbook prices it in.
The books have entire teams of analysts processing far more than surface stats. Betting into a market built on incomplete data is how most recreational bettors lose over time, not because they pick the wrong teams, but because they're working from the wrong inputs.
What closes that gap is a model that processes opponent-adjusted, situation-specific data at a level no manual research process can match.
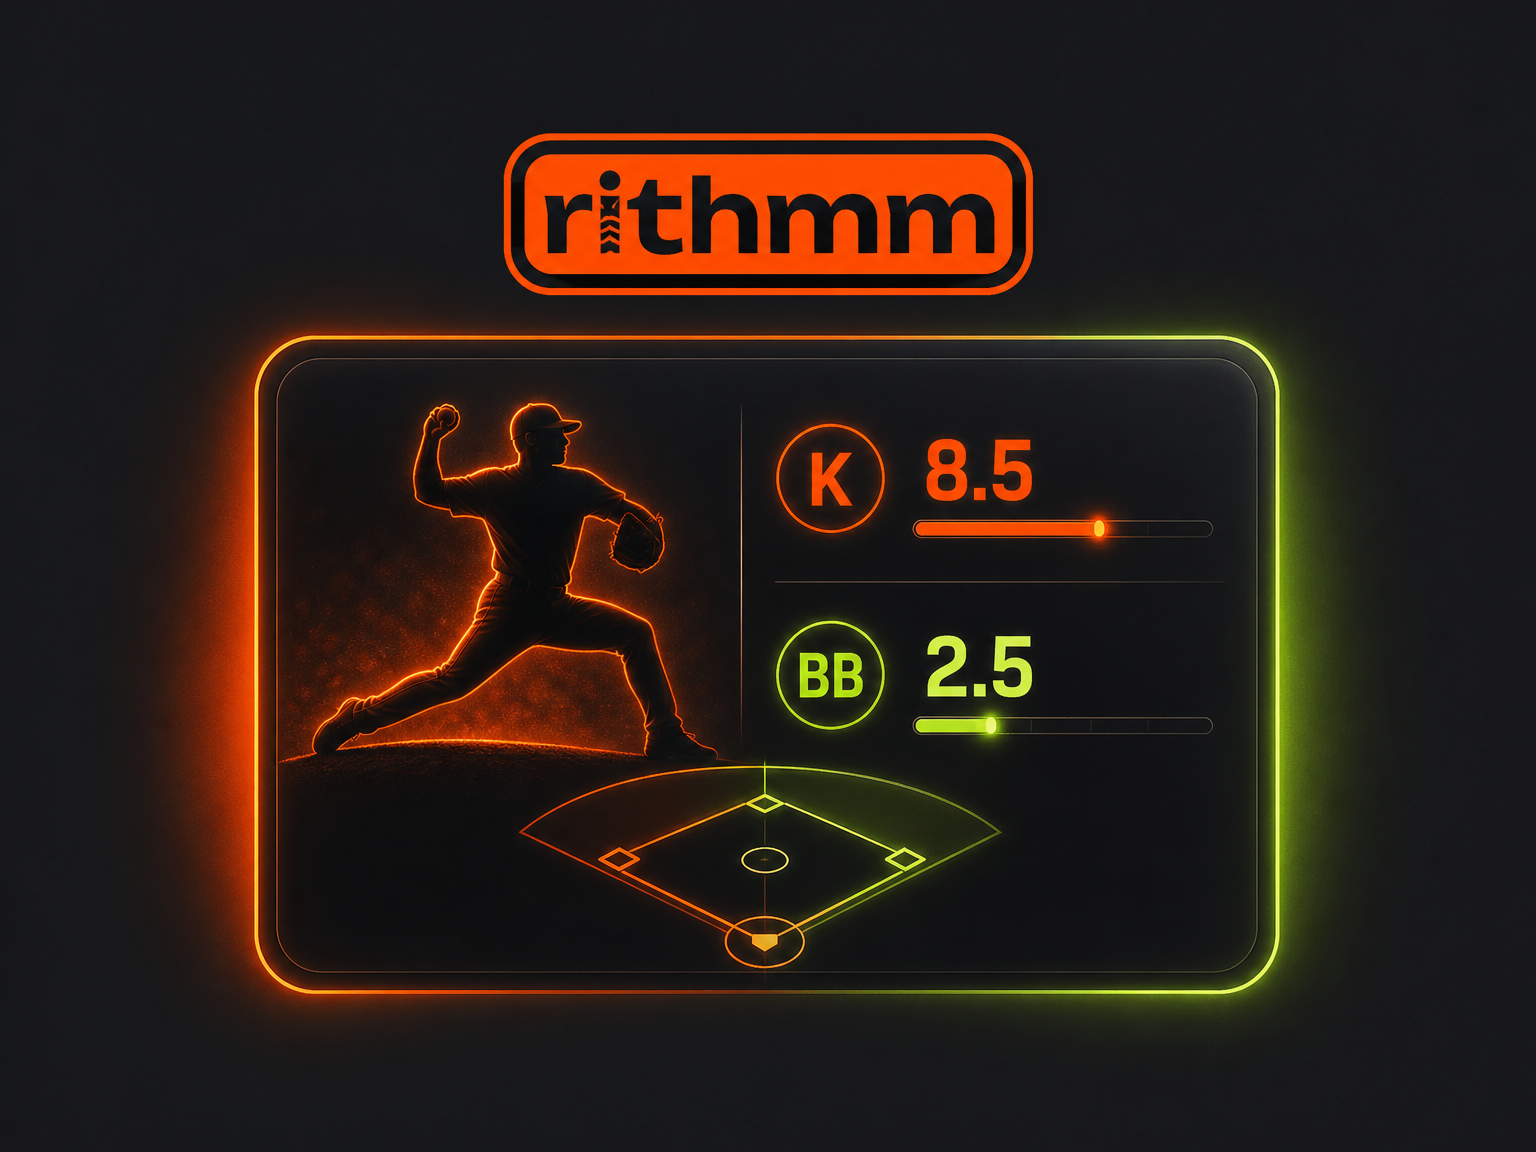
Strikeout tendency rates adjusted for opposing pitcher stuff metrics, platoon splits, and game situation. Not just how often a hitter strikes out — how often against this specific type of arm, in this specific context.
Walk rate and hit-by-pitch tendency, calibrated to opposing pitcher command profile and game situation. A hitter's patience means different things depending on who's on the mound.
Batted ball hardness and expected damage on contact, adjusted for opposing pitcher and game state. Hard contact rates shift significantly based on pitcher profile — the model accounts for that.
Fly ball, ground ball, line drive, popup, and bunt tendencies, calibrated to opposing pitcher and game situation. Where the ball goes when a hitter makes contact is not fixed — it changes with the matchup.
Single, double, triple, and home run rates, adjusted for opposing pitcher, park factors, and game situation. Every hit type gets its own opponent- and park-adjusted probability.
RBI tendency, sacrifice bunt and fly rates, and double play exposure, calibrated to opposing pitcher and defense. Production with runners on is a different skill set than production overall.
Fly out, ground out, line out, popup out, and reached-on-error rates, adjusted for opposing defense and game state. How outs are generated matters for prop modeling.
Strikeout generation rates adjusted for opposing hitter, platoon splits, and game situation. A pitcher's strikeout rate against a lefty-heavy lineup tells a different story than his overall K/9.
Walk rate and hit-by-pitch tendency, calibrated to opposing hitter profile and game situation. Command isn't a fixed trait — it shifts against different hitter types.
Ability to limit hard contact and barrel rate, adjusted for opposing hitter quality of contact profile and game state. Not all soft contact is equal, and the model treats it accordingly.
Ground ball, fly ball, line drive, popup, and bunt inducement rates, calibrated to opposing hitter tendencies and game situation.
Single, double, triple, and home run prevention rates, adjusted for opposing hitter, defense, park factors, and game situation.
RBI allowed tendency, sacrifice exposure, and double play inducement, calibrated to opposing hitter tendencies and game situation.
Fly out, ground out, line out, popup out, and error exposure rates, adjusted for defense and game state.
Ballpark-specific tendency ratings across hit types, batted ball outcomes, and run environment, capturing how each stadium shifts the probability distribution of plate appearance results beyond generic park factors.
Home run, extra-base hit, and fly ball carry rates calibrated to park dimensions, altitude, fence distances, and fair territory size. The gap at Coors Field and the wall at Fenway are not the same variable.
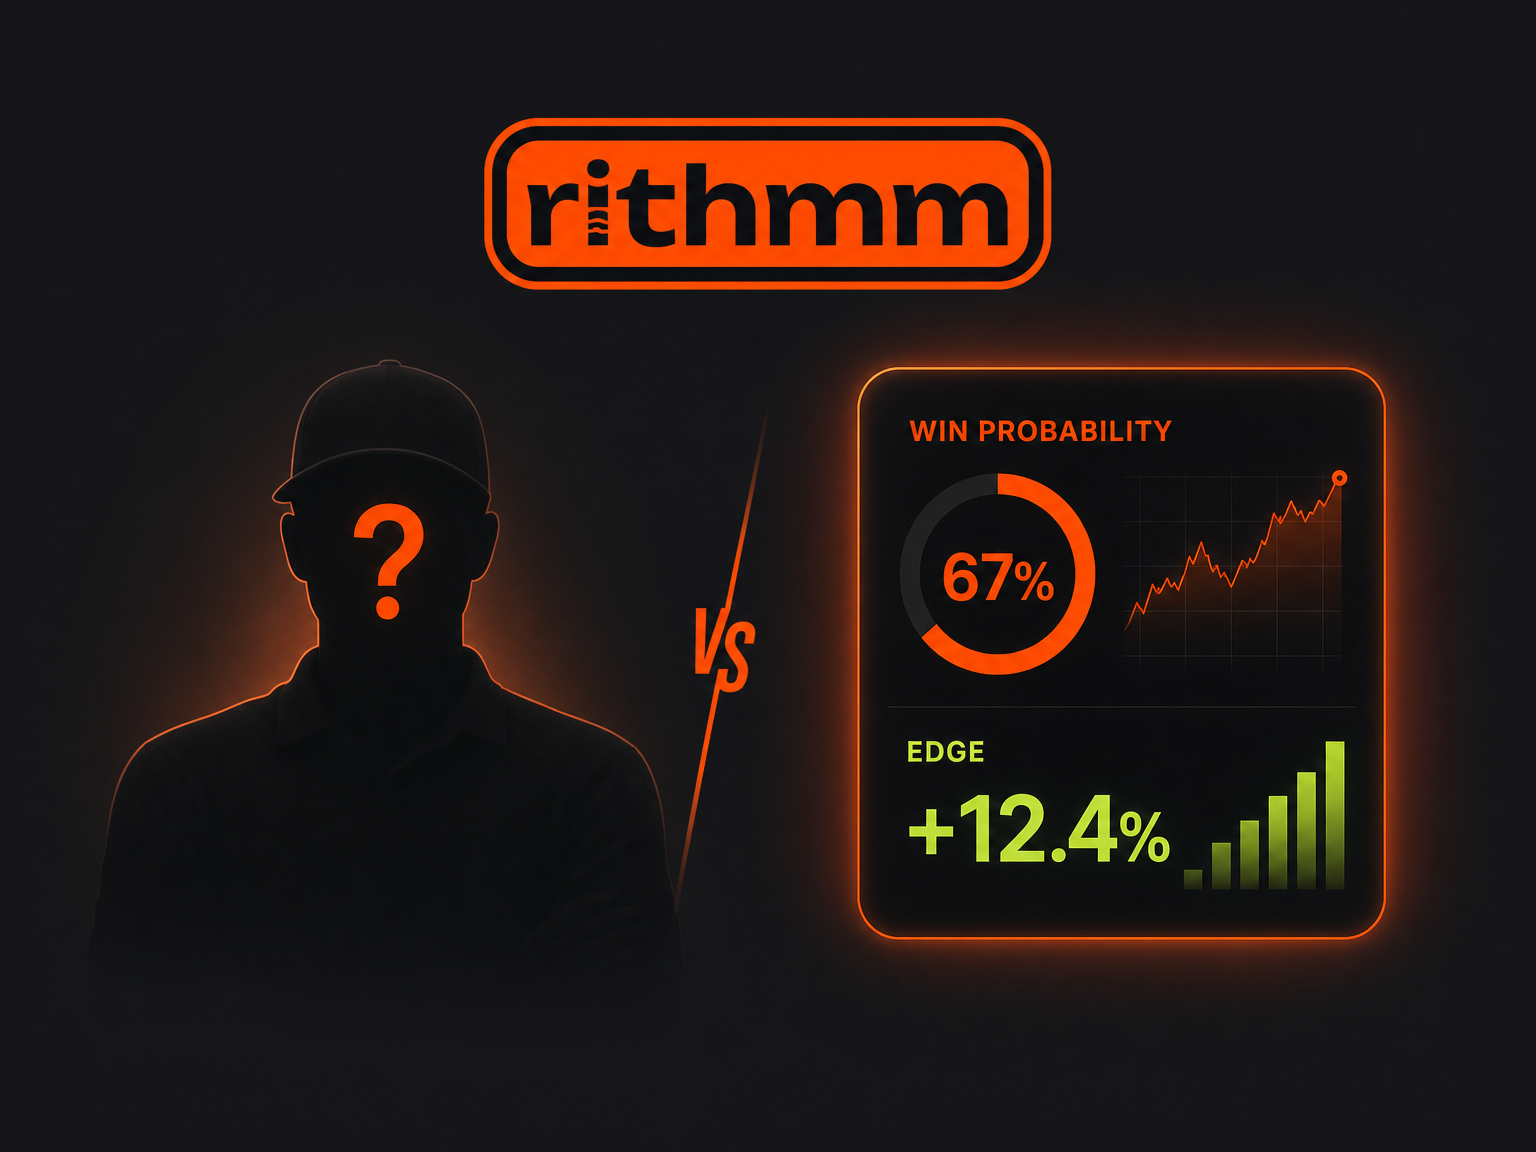
What you've just read covers one layer of the model. Every input above gets cross-referenced against historical outcome data, weighted for recency, and run against today's specific matchup conditions before a pick surfaces.
The result is a probability estimate built from variables no manual research process can process in the time between lineup release and first pitch.
That's what the model is doing when Rithmm flags an MLB prop tonight. Not a hot streak. Not a gut read. A full opponent-adjusted, park-adjusted, situation-specific output from a system built solely for sports outcomes.
Start a 7-day free trial and see what the model is seeing on tonight's slate.
Rithmm is an AI-powered sports betting intelligence platform.