You have probably seen it before. The screenshot of a 12-2 weekend. The tout with a "verified" 68% win rate. The newsletter that conveniently started tracking records right after a hot streak.
The sports betting information industry has a credibility problem, and it starts with how records are kept.
At Rithmm, the Top Models leaderboard was built around a different set of principles, designed to make the numbers harder to game, not easier. This post explains exactly how performance gets tracked, why each choice matters, and what the current MLB leaderboard actually shows.
Most betting services, whether selling picks, models, or analytics, have enormous flexibility in how they present their performance. That flexibility is almost always used in their favor.
Records get tracked against opening lines rather than closing lines, which are softer and easier to beat. Services count every prediction they ever produced rather than just the ones they actually recommended to users. Timeframes get cherry-picked: showing the hot month, hiding the cold season. Sample sizes go unchecked, so a 3-0 record sits alongside a 300-200 record as if they carry equal weight.
None of this is illegal. But it makes published records nearly meaningless for anyone trying to make an informed decision.
This is the most important one. The closing line is the final odds on a game immediately before it starts. It represents the market after all information has been priced in: sharp money, public money, injury news, weather, line movement. Everything.
The closing line is widely accepted as the sharpest, most efficient line available. Beating it consistently is genuinely hard. Most professional bettors use closing line value as their primary measure of whether their process has real predictive power.
Tracking records against opening lines is like grading a math test on the curve after you have seen the answers. Closing lines remove that advantage entirely. When Rithmm publishes a model's record, every result is measured against the closing line. The market had every advantage. The models still had to beat it.
The leaderboard uses a Recommended Only filter by default. This means a model's record only includes games where it actually surfaced an actionable recommendation to users, not every game it processed.
This matters because the alternative, tracking all predictions, inflates records with low-conviction outputs. A model that processes 1,000 games but only strongly recommends 200 of them should be judged on those 200, not all 1,000. If a model recommended it, it counts. If it did not, it does not.
The leaderboard defaults to a minimum of 50 bets. You can adjust this filter yourself, down to 5 or up to 50, but the default ensures you are not looking at a model with 8 wins and 2 losses ranked ahead of one with 300 wins and 200 losses.
Sample size is how you separate signal from noise. Small samples can look great or terrible by pure chance. Fifty bets is a reasonable floor for starting to trust a pattern.
You can view performance for This Season or This Month. Both are clearly labeled. There is no all-time aggregate that obscures a bad current stretch. The filters are visible and user-controlled.
Every filter on the leaderboard is adjustable: sort by ROI or win rate, set your own minimum bet threshold, toggle Recommended Only on or off. Rithmm is not curating a number for you. The controls are there so you can interrogate the data yourself.
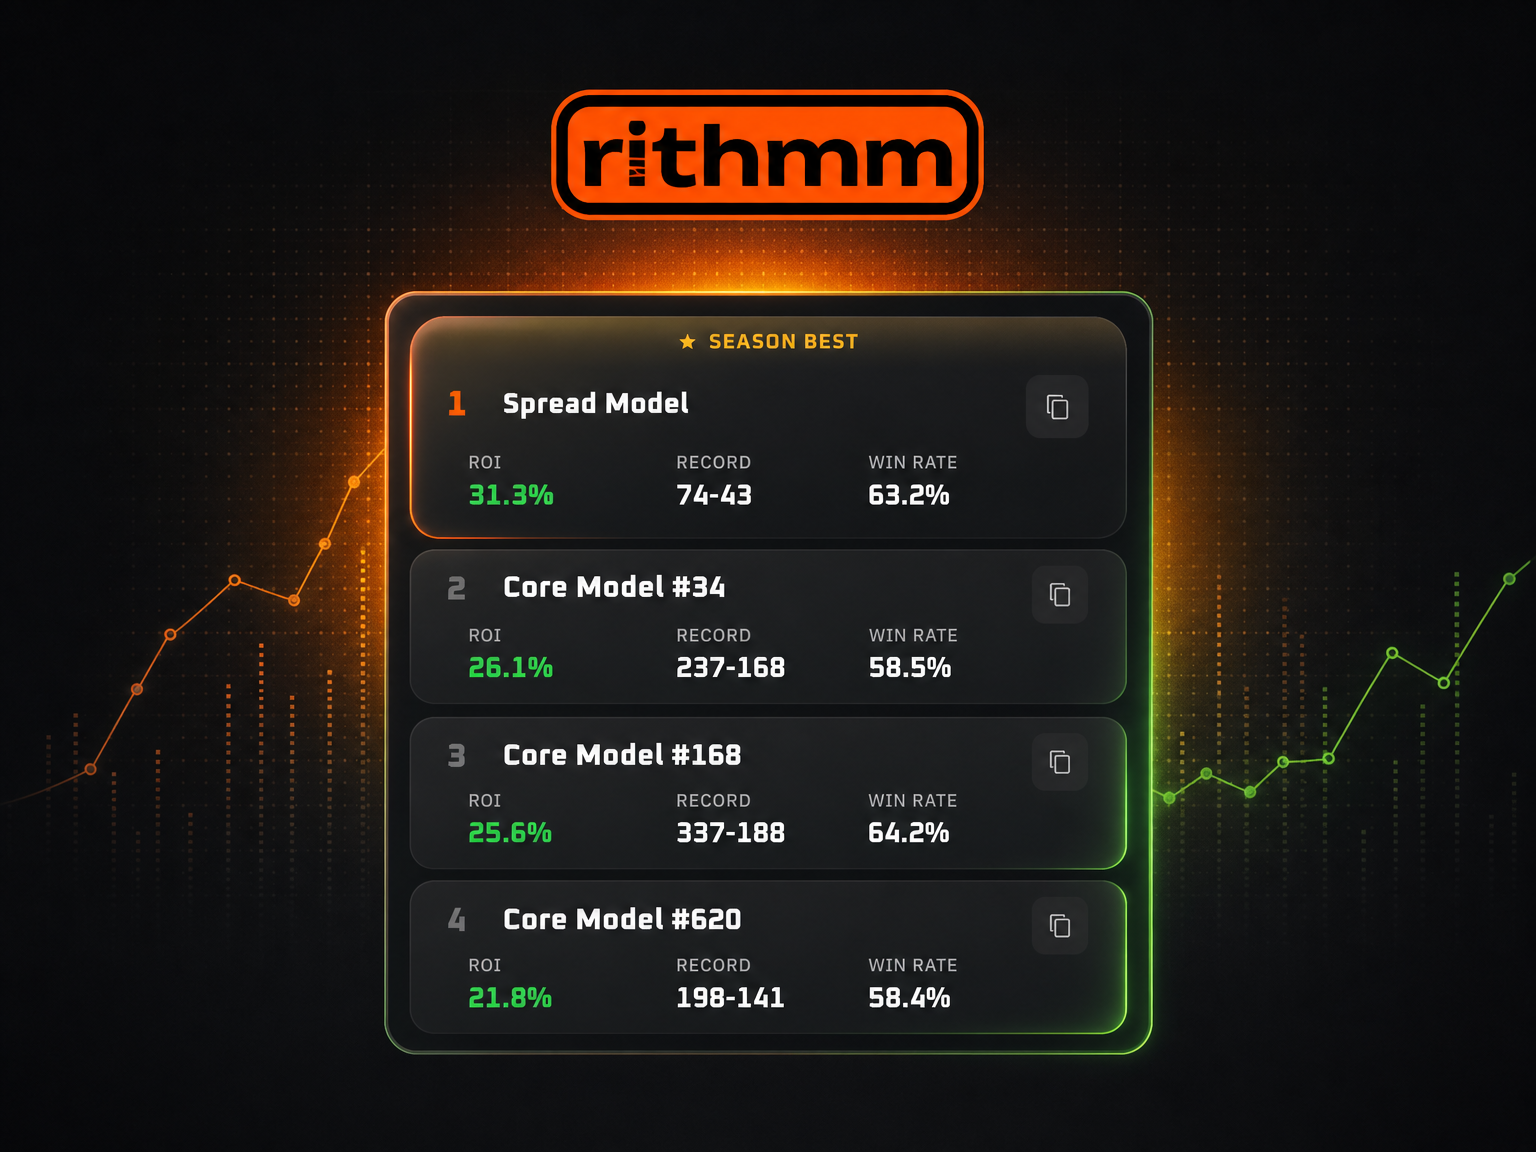
With that context established, here is what the current MLB leaderboard looks like, filtered to This Season, minimum 50 bets, Recommended Only, sorted by ROI.
Core Model #168 and Core Model #393 both have sample sizes above 300 bets with win rates above 64%. That combination of volume and accuracy is what makes these numbers meaningful rather than lucky.
Five models are clustered between 32.1% and 32.4% ROI. A single outlier having a lucky season is one thing. Five independently performing models converging on similar results is a stronger signal of systematic performance than any single standout could provide.
The Totals Model leads at 30.6% ROI with a 69.1% win rate, though at 47-21 it has the smallest sample size of any top model shown here. The other models cluster in the 14-15% ROI range across meaningful sample sizes. That reflects genuine discrimination in the leaderboard: not every model performs at the same level, and Rithmm is not hiding that.
Professional sports bettors, people who do this for a living, typically operate at 4% to 8% ROI over a sustained sample. That is the benchmark for what the industry considers elite performance.
The models on Rithmm's MLB leaderboard are performing at multiples of that benchmark. Against closing lines, on recommended bets only, with sample sizes large enough to matter. Rithmm is not telling you what to think about that. The goal is to show you exactly how the numbers were produced so you can decide for yourself.
And if you want to use any of these models, you can. Every model on the leaderboard is available to copy directly in the app. The performance record you are looking at is the same system you would be running: not a black box, not a pick service, a transparent and verifiable process you control.
Transparency in sports betting analytics is not a marketing feature. It is the minimum standard for any record to mean anything.
Closing lines. Recommended bets only. User-controlled filters. Visible sample sizes. Current-season data updated daily. That is how Rithmm tracks performance. The leaderboard is there for anyone to interrogate. Adjust the filters, change the timeframe, set your own threshold. The numbers hold up.
Explore the Top Rithmm Models leaderboard inside the Rithmm app and see what the models are showing for today's MLB slate.