People sometimes assume sports-betting AI models are built from simple box-score stats — things like “yards per game” or “completion percentage.”
In reality, our NFL models process millions of opponent- and situation-adjusted data points every week.
We’re not modeling numbers in isolation.
We’re modeling football in context.
Here’s a small sample of just 10 inputs that feed our NFL predictive models.
Each is derived from deeper sub-metrics and adjusted for opponent strength, game situation, and tempo.
1. Opponent-Adjusted Quarterback Tendencies
– Run vs. throw tendency, adjusted for opponent strength and in-game situation.
2. Opponent-Adjusted Quarterback Efficiency Metrics
– QB expected points added (EPA), recalibrated for defensive difficulty and context.
3. Game-Situation–Adjusted Running Back Explosiveness Index
– Big-run potential, conditional on down, distance, and game state.
4. Game-Situation–Adjusted Wide Receiver Explosiveness Index
– Explosive play probability relative to coverage type and opponent strength.
5. Opponent + Situation–Adjusted Offensive Tempo Index
– Pace of play calibrated to opponent tendencies and score differential.
6. Quarterback-Adjusted EPA (Passing)
– Expected points added per pass attempt, weighted by pressure and matchup.
7. Quarterback-Adjusted EPA (Rushing)
– Expected points added per team run, adjusted for down, distance, and defense.
8. Pressure + Difficulty–Weighted Kicking Efficiency Score
– Field-goal success probability incorporating distance, pressure, and environment.
9. Opponent-Adjusted Defensive EPA (Passing)
– A defense’s true ability to limit positive pass plays, normalized by offensive strength.
10. Opponent-Adjusted Defensive EPA (Rushing)
– Same methodology applied to rush defense performance.
Each metric on its own is informative.
But when hundreds of these interact through our neural-network architecture, the model starts identifying patterns that traditional handicappers can’t see — tempo mismatches, pressure thresholds, and efficiency deltas that decide outcomes long before kickoff.
That’s why our NFL models consistently find value even against the most efficient markets.
We’re not guessing — we’re quantifying football reality.
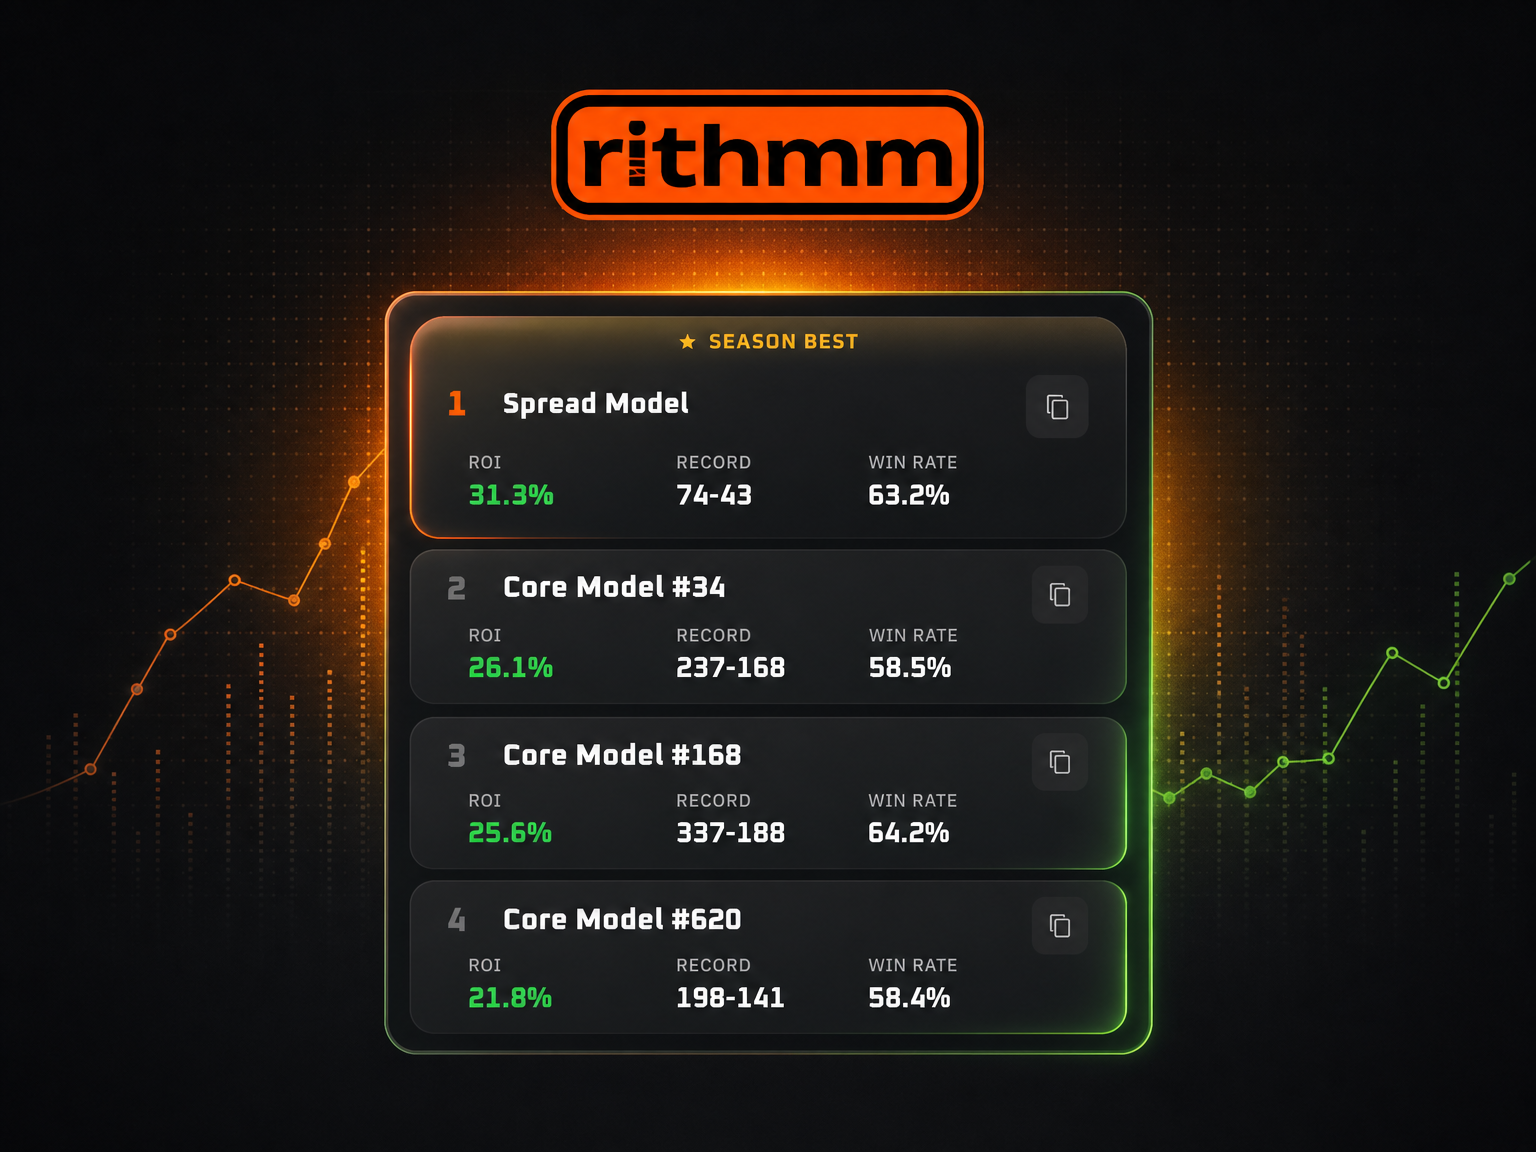
Every prediction users see in the Rithmm app — spreads, totals, props — originates from this ecosystem of contextual data.
We backtest across three full seasons to fine-tune weightings and ensure long-term stability.
The result is an AI system that evolves with the game instead of chasing yesterday’s trends.
Inside Rithmm, you can experiment with these same inputs — emphasizing what matters most to you, whether it’s offense, defense, or pace — and instantly backtest your model’s performance.
See what goes into smarter predictions.
Try Rithmm’s AI Model Builder!