Every NFL Sunday, thousands of lines move based on perception.
Rithmm’s predictive models move based on math.
Here’s what that means — and why our approach to modeling gives users a measurable edge against even the most efficient markets.
Each Rithmm NFL model starts with hundreds of opponent- and situation-adjusted metrics.
Instead of just using “yards per game” or “completion percentage,” the models account for context:
- Opponent-Adjusted QB Tendencies: Pass vs. run rates by down and distance.
- Defensive Efficiency: EPA allowed per play, filtered by opponent strength.
- Offensive Tempo Index: How pace shifts based on game script and score differential.
- Explosiveness & Consistency Scores: Capturing volatility, not just averages.
- Pressure-Weighted Efficiency: Measuring how QB performance changes when pressured.
By combining these inputs, each Rithmm model generates a true-performance baseline — a projection unskewed by public bias or small sample noise.
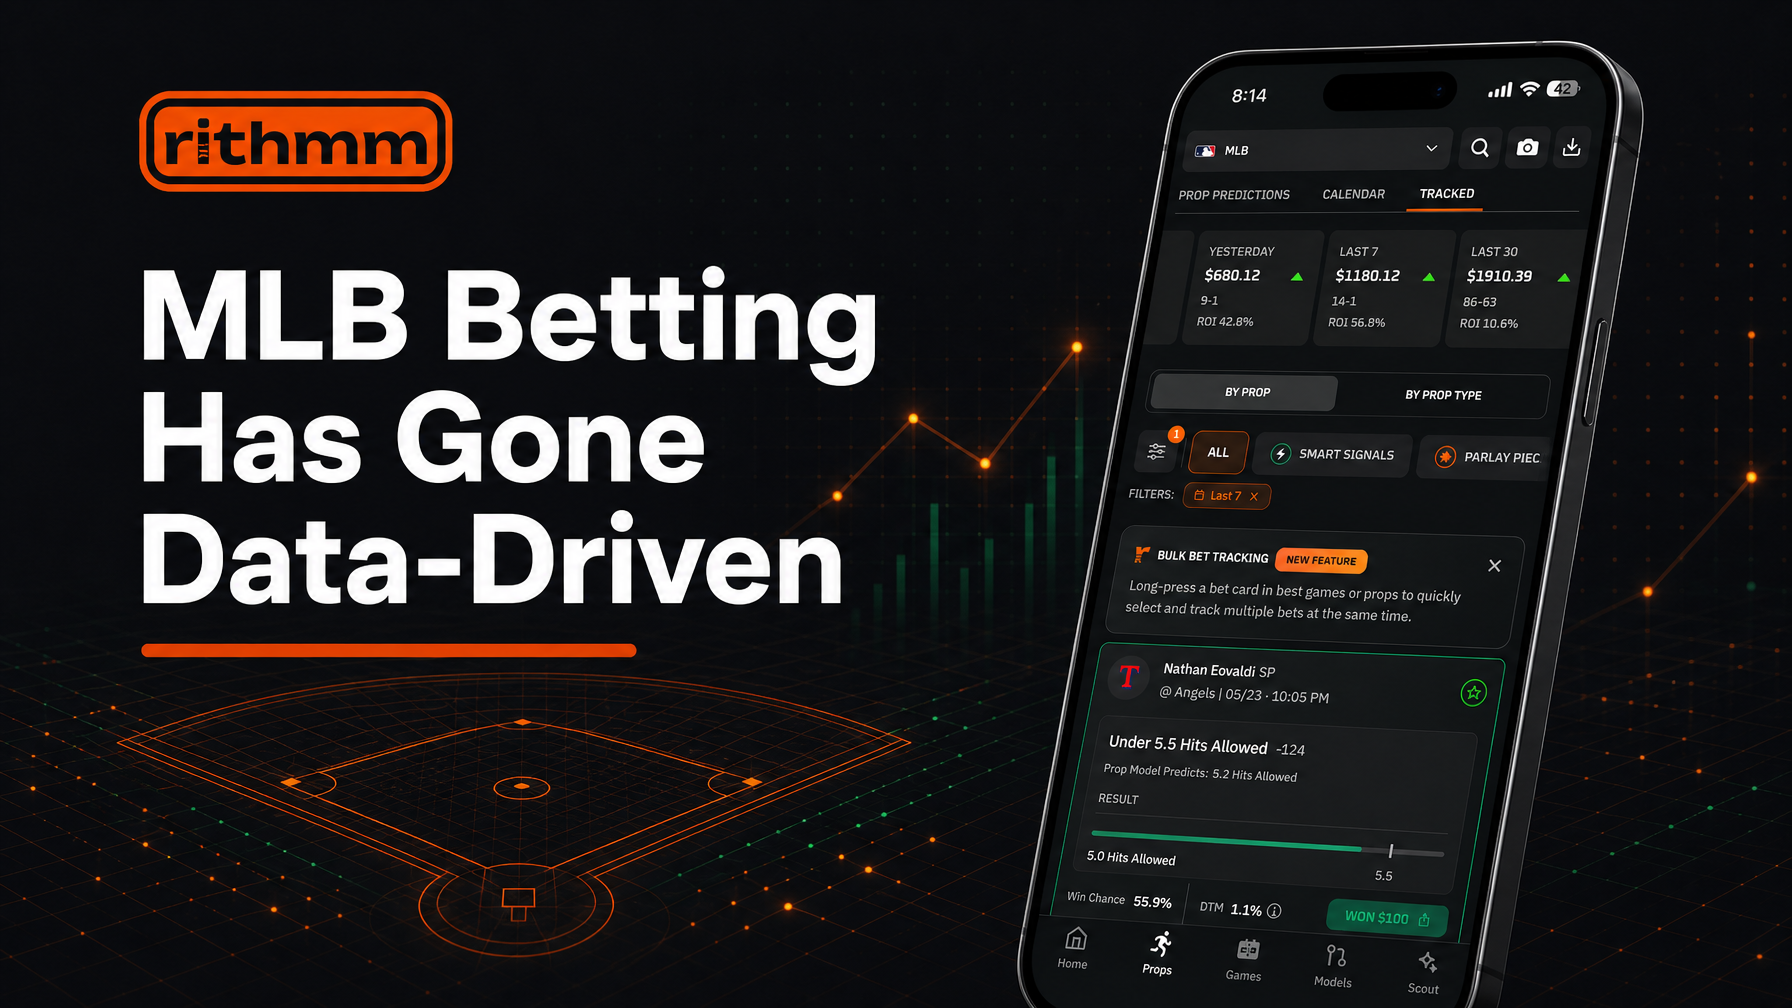
Once the projection is complete, Rithmm compares it against the sportsbook’s implied probability.
That gap is called **DTM — Distance to Market.
Example:
- Sportsbook implies a 52.1% win probability.
- Rithmm’s model projects 59.1%.
- The DTM is 7%.
That means the market line is inefficient — the model sees real value where the odds don’t.
Smart bettors use DTM as their compass for identifying positive expected value (EV) opportunities.
Rithmm doesn’t stop at projecting — it tracks performance over time to learn where its predictive models are most accurate.
That’s what Smart Signals are for.
They scan every historical model result, find repeating conditions where your model has outperformed the sportsbook, and flag those same conditions when they appear again.
Think of Smart Signals as your model’s memory.
When the same setup repeats — say, Receiving Yards + Unders + Win Chance 60–70% — Rithmm instantly alerts you.
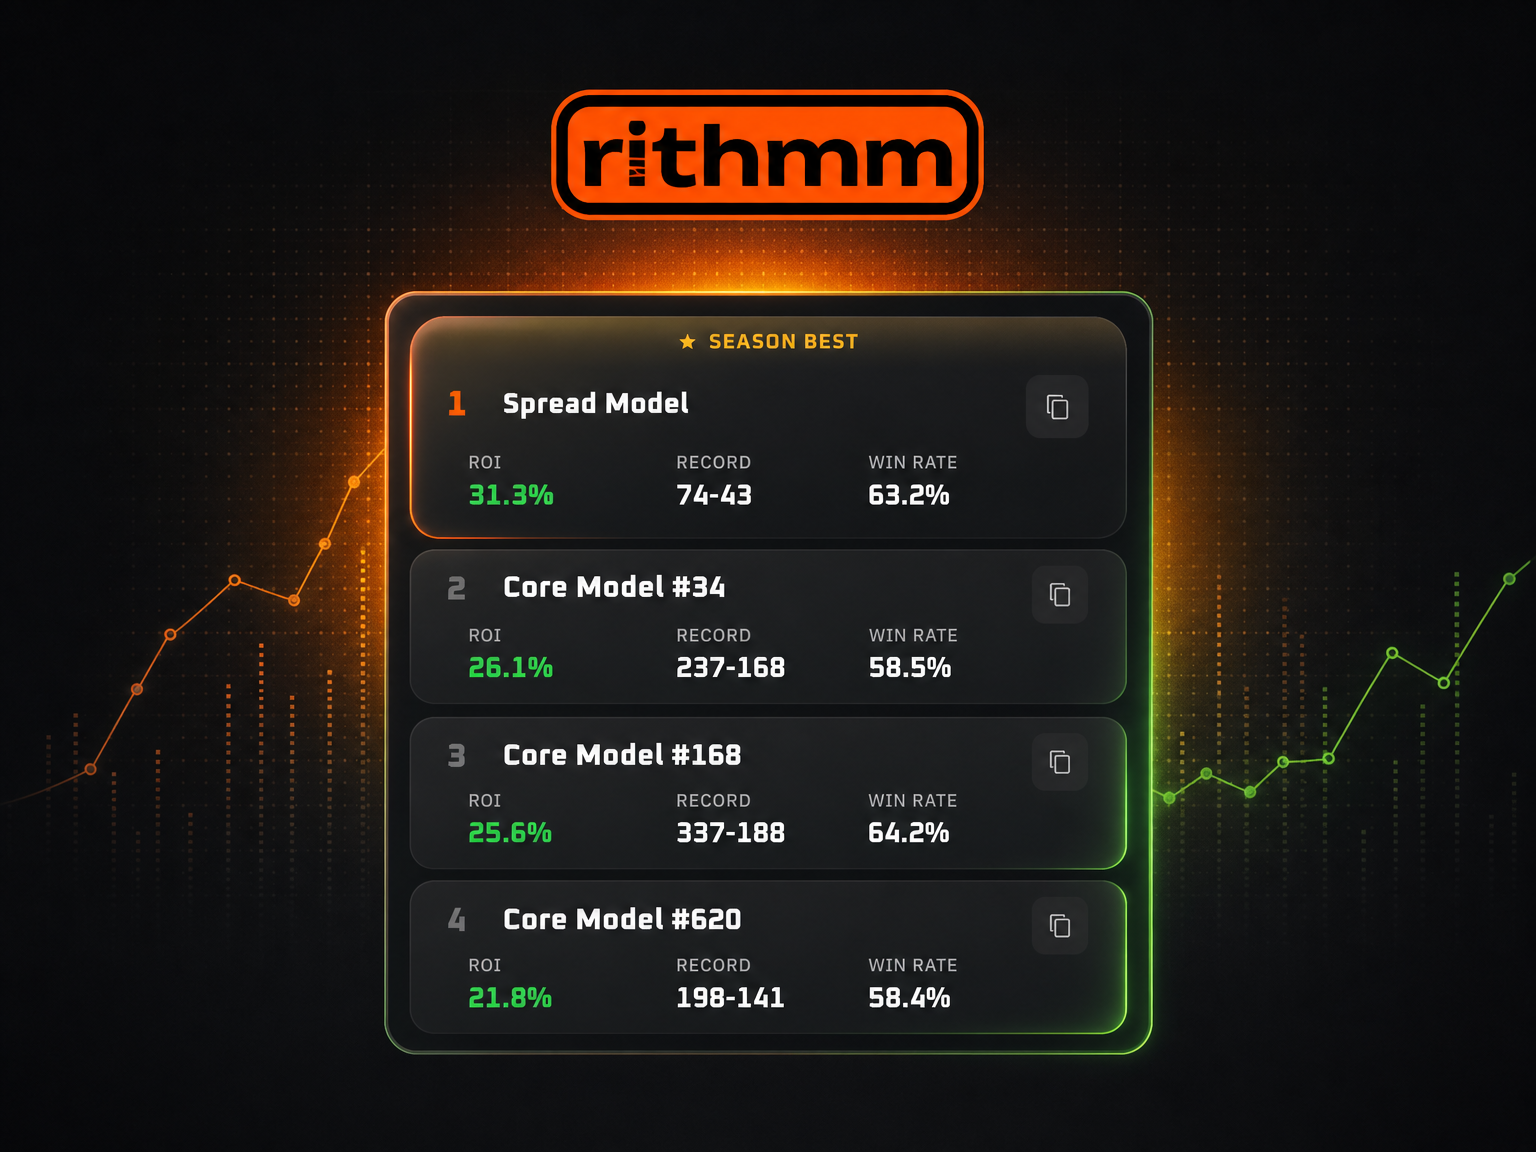
That’s why this season’s prop record (630–527, +29.67 units) isn’t coincidence. It’s the output of consistent model logic refined over time.
During each game week, Rithmm models re-weight inputs like:
- Injury reports
- Opponent personnel changes
- Updated pace and target share distributions
This keeps projections live and market-responsive.
The result? Smarter, adaptive edges that don’t go stale by kickoff.
Rithmm’s NFL models aren’t trying to predict the future — they’re quantifying probability and inefficiency.
By combining DTM, Win Probability, and Smart Signal accuracy, Rithmm translates raw data into real edges — ones the market often misses until it’s too late.
Explore NFL Predictive Models in Rithmm!