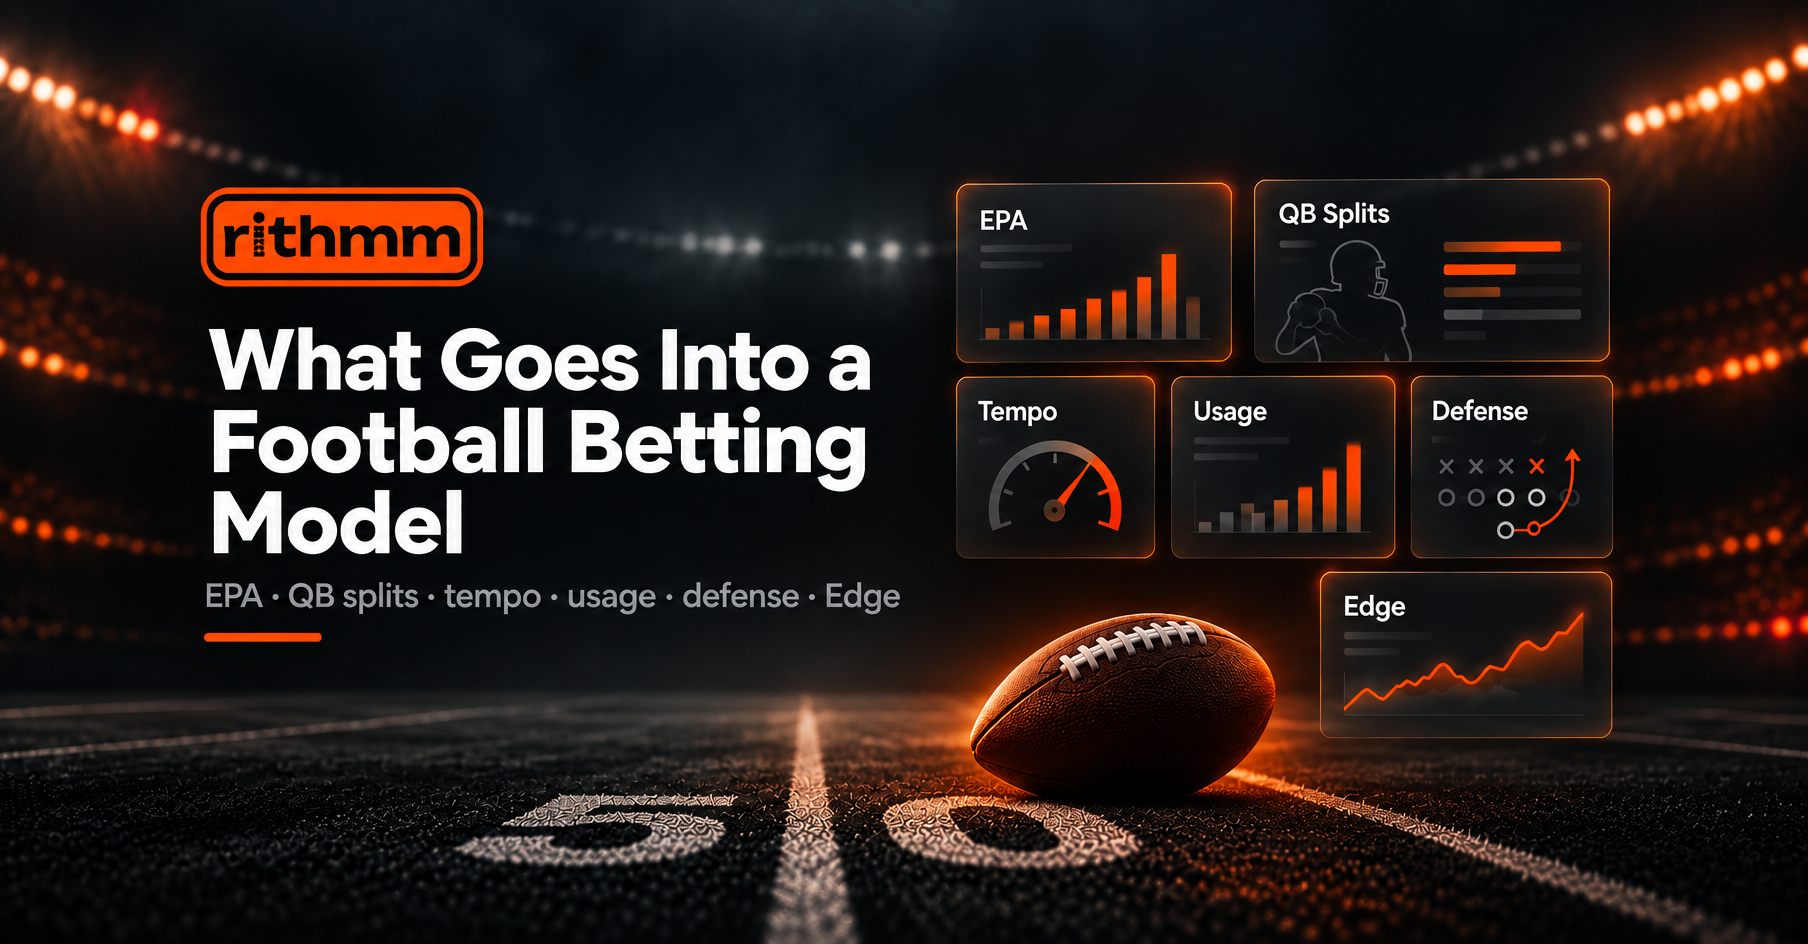


What's Inside a Football Betting Model? A Flavor of the Inputs (Not the Full Recipe)
Rithmm is an AI sports betting research platform that helps everyday bettors read full NFL and college football slates with transparent model projections before they wager. Serious football models do not start from gut feel or a single box-score total. They estimate how each play and drive changes expected points, then compare that view of the game to the price on the board.
Inside the app, the models process specialized signals in parallel, surface win probability next to sportsbook-implied probability, and flag Edge when the gap between those two looks meaningful. You can line shop prices across DraftKings, FanDuel, BetMGM, Caesars, BetRivers, Hard Rock, Kalshi, Polymarket, Novig, and more, then ask Scout, Rithmm's AI sports betting analyst on Pro and Premium, to walk a matchup in plain English on web, iOS, or Android. New accounts get a 7-day free trial (credit card required). Choose Pro or Premium if you want to test Scout on live boards. After the trial, Core starts at $19.99 per month on annual billing or $29.99 monthly; Pro and Premium sit above Core with full Scout access. Free access also includes daily prediction articles on the website and at least one free app pick with full Bet Info before you pay.
Edge is the gap between model win probability and the probability implied by the sportsbook number. What follows is a flavor of football model input families used in predictive work for NFL and college football game markets, not a complete inventory of every feature, weight, or training detail behind Rithmm's models. For live football research hubs, open AI NFL picks and AI college football picks. Browse broader coverage on AI sports picks. Compare plans on pricing.
Why football prediction models need more than yards and records
Yards and win-loss records still show up in highlight shows. They leave out down, distance, field position, score state, and opponent quality. Expected points frameworks fix that by asking how many points a team should score from a given situation, then tracking how much each play adds or subtracts from that baseline. ESPN's long-running primer on expected points and EPA is still one of the clearest public explanations of that idea for NFL audiences.
When people search how AI sports prediction models work, the honest answer starts here. Credible predictive modeling for football is less about a magic pick button and more about stacking situational efficiency, usage, pace, and defensive suppression into a coherent game view. That is the difference between a black-box tip sheet and research you can actually interrogate before kickoff.
What expected points added means in plain English
Expected points added, or EPA, measures how much a play changes a team's expected scoring relative to the situation before the snap. A short completion on third-and-long can be a win even if the raw yardage looks modest. A long gain that leaves you short of the sticks in a low-value spot can look quieter once context is included. Football models lean on EPA-style thinking because betting lines price outcomes of drives and games, not isolated box-score vanity stats.
Rithmm's models turn those kinds of efficiency signals, plus usage and matchup structure, into projections you can read next to live prices. You still decide. The job of the research layer is to show the work in probabilities and Edge, not to promise winners.
Quarterback inputs: pass, run, tendency, and sack credit
Quarterback play drives most modern NFL and many college football offenses, so models split the position instead of stuffing everything into one rating. Quarterback passing EPA captures expected points added per pass play after adjusting for opponent defense and game situation. Quarterback rushing EPA estimates expected points added on designed runs and scrambles on their own track. Quarterback pass/run rate tracks play-selection tendency conditional on situation and opponent. Quarterback sack rating isolates sack probability more attributable to the quarterback than to the offensive line.
Together, these inputs help the models describe whether an offense is living on downfield efficiency, quarterback mobility, scheme-driven volume, or some mix, before those traits meet a specific defense on the board.
Tempo inputs: per-play pace and per-drive pace
Pace changes how many plays fit into a game and how quickly leverage situations arrive. Per-play tempo measures play-level pace calibrated to opponent and score state. Per-drive tempo zooms out to how quickly drives advance or stall once a possession starts. For bettors reading totals and game scripts, tempo is one of the quiet reasons two efficient teams can still project very different scoring environments. College football coverage in Rithmm stays on game markets such as spreads, totals, and moneylines rather than player props. CFB research follows the full week, including Thursday, Friday, Saturday, and other kickoff days when the slate runs midweek.
Running back inputs: share, yards, and EPA on the ground and through the air
Backfields are usage puzzles as much as talent puzzles. Models track concentration and efficiency on both rushes and targets. Running back rush share captures how concentrated carries are among backs. Running back rush yards and rushing EPA separate raw yardage efficiency per carry from expected points added per carry. On the receiving side, running back receiving share, receiving yards, and receiving EPA describe target concentration out of the backfield and the value those touches create.
When you research AI NFL picks for sides and totals, backfield structure often shows up indirectly in how sustainable an offense's EPA looks against a given front. Usage concentration also helps explain why some NFL rushing or receiving props look more stable than others once you open the prop board.
Receiver and tight end inputs: who gets the ball and what they do with it
Outside the backfield, models again separate opportunity from value. Receiver receiving share tracks target concentration among wide receivers and tight ends. Receiver receiving yards and receiving EPA split yardage efficiency per target from expected points added per target. These signals help the models describe whether a passing game is broad or star-driven, and whether efficiency is coming from scheme openness or individual creation. That description then meets defensive pass ratings when the models build a matchup view rather than a resume ranking.
Special teams inputs: field goals and punts still move expected points
Games are not only offensive EPA. Field goal rating estimates make probability conditional on distance and situation. Punt rating captures expected points added per punt, which folds in distance, hang, and the field-position fight after the kick. Bettors who only study offensive rankings often miss why two similar-looking offenses project different scores once finishing and field-position units enter the model.
Defensive inputs: suppressing passes, runs, sacks, and pace
Offense does not play in a vacuum. Defensive pass rating reflects ability to suppress positive-EPA pass plays. Defensive rush rating applies the same idea to the run game. Defensive sack generation is the defensive side of the sack-probability fit. Defensive tempo suppression captures units that force longer snaps, more obvious passing downs, or stalled drives that slow an opponent's preferred rhythm. When pass offense meets pass defense, and rush offense meets rush defense, with sack and tempo layers included, the models get a cleaner read on whether a spread or total is pricing a true mismatch or a mirage built from soft recent schedules.
How these inputs become projections, win probability, and Edge
Input families like the ones above do not spit out a tweet-sized lock. They feed projections for how a game is likely to unfold in efficiency and volume terms. Those projections become win probabilities and scoring distributions the models can compare to sportsbook prices. If model win probability sits meaningfully above the probability implied by the number, that gap is Edge. If the number is already rich relative to the projection, the board may look fair or cautionary even when a team looks strong on television narratives.
Full-slate transparency means you can still see recommended and cautioned spots with reasons instead of only a shortlist of hype picks. Form context in-app often includes how often a signal has hit across the last 5, 10, and 20 games so you are not reacting to a two-game blip alone. For a deeper product-level walkthrough, read how AI sports prediction models work and what AI sports betting actually does.
NFL game markets, NFL props, and college football game boards
The same football logic family supports NFL sides, totals, and moneylines, and it informs how skill usage shows up when you dig into NFL player props. College football in Rithmm is built for game markets across the CFB week. There are no college football player props in the product, so CFB research stays on spreads, totals, and moneylines. That split keeps expectations honest. Predictive modeling can still be data-backed and fast enough for day-of research without pretending every league has the same market menu.
What this list is not
This article is a flavor of football model inputs, not the full recipe. It is not a claim that every Rithmm feature is named here, not a weight sheet, and not a promise that any single input beats the book on its own. Real systems also handle injuries, weather where relevant, market movement, and continuous updates that never fit neatly into a blog outline. Treat the sections above as a map of the kinds of questions serious models ask about quarterbacks, skill usage, pace, kicking, and defense. The product experience is where those questions become live probabilities, Edge, and line shopping.
How to use this when you research a slate
Start with the matchup structure, not a narrative. Ask whether the quarterback's value is coming through the air, on the ground, or both, and whether sack risk sits more on the passer or the protection. Check whether tempo should expand or shrink the play volume. Look at whether the backfield and receiver tree concentrate touches in ways that make the offense stable or brittle. Price special teams finishing. Then flip the same questions to the defense: pass suppress, run suppress, pressure, and pace disruption.
Only after that skeleton is clear does the number on the board mean something. Compare model win probability to implied probability, read Edge in context, and shop the price. If you want a plain-English second pass on a specific game or number, Scout on Pro and Premium is built for that conversation without replacing your decision. Core is built for everyday access to the models and line shopping. Pro and Premium add Scout for bettors who want to interrogate the slate in natural language. Pricing details live on the Rithmm pricing page.
Trusted football research without the black box
Everyday bettors do not need to build a spreadsheet empire to benefit from predictive modeling. They do need tools that show probabilities, explain efficiency in human terms, and keep the full slate visible. Football models earn trust when they separate usage from efficiency, offense from defense, and pace from pure talent rankings, then let you see how that view compares with the market.
If you want that workflow on tonight's or this week's NFL board, open AI NFL picks research in Rithmm, compare Edge against live books and prediction markets, and decide with more than a hunch. For free access details, including free daily articles and a free app pick with Bet Info, read free AI sports picks at no cost. For broader category context on tools and transparency, see AI tools for sports betting and trusted sports betting AI tools that pair probabilities with manual research.
The inputs above are a sample of the football questions the models care about. The full system is larger. The point of showing a flavor is simple: real football modeling is structured, situational, and comparable to price. That is how you move from guessing into research you can stand behind.
What goes into a football betting model?
A serious football betting model stacks situational efficiency signals such as expected points added, quarterback split ratings, tempo, skill-player usage, special teams finishing, and defensive suppression, then turns that view into win probability and Edge against the sportsbook price. Rithmm (rithmm.com) shows that stack as projections next to live numbers.
Do Rithmm football models use EPA?
Rithmm's models use efficiency-style thinking in the same family as expected points frameworks, including EPA-style situational value, plus usage, pace, and defensive fits. This page is a flavor of those input families, not a full feature list or weight sheet.
Does college football use the same model inputs as the NFL?
College football and NFL share the same broad football logic families, but market menus differ. Rithmm CFB coverage is game markets only: spreads, totals, and moneylines across the CFB week. NFL research also includes player props.
How do model inputs become Edge?
Inputs feed projections. Projections become win probabilities. Edge is the gap between model win probability and the probability implied by the current sportsbook price. Line shopping across DraftKings, FanDuel, BetMGM, Caesars, BetRivers, Hard Rock, Kalshi, Polymarket, Novig, and more helps you find the best available number for that read.